Page text
The Vita f
THE

VITA L FL AM E
   COMPTON MACKENZIE


       Illustrated by forty-two pictures
          in Colour Photography
             and seven pages of
                Isotype Charts


                  LONDON

  PUBLISHED FOR THE BRITISH GAS COUNCIL BY

       FREDERICK MULLER LTD
          29 GREAT    JAMES STREET

                      wci
LIST OF CHARTS IN COLOUR
Following page 80
©
Gas Made, per Head of Population
Range of By-products of the Gas Industry
Gas Consumers in the Regions of Great Britain, 1946
Annual Gas Sales in Great Britain
London Area: Smoke Pollution. Gas and Coke OutputGas Made, per Head of Population.
_MANUFACTURED. GAS NATURAL GAS
United States # =i BR
Be
Great Britain 2
Netherland
Denmark
Sweden
Germany
Switzerland &
Each complete unit with flame represen
ts 500 cubic feet of gos.
ISOTYPE
INSTITURange of By-Products of the Gas Industry.
Ww
Ww
ve
EJ FERTILIZER
REFRIGERANTS :
a EXPLOSIVES
COAL |
CARBONISED _
seen ) & / : }})
FRUIT TREE 'y woop :
= =
omer aumenea
li) BRIQUETTES| | (SPRAY ROAD TAs *PRESERVATION| | PHOTOGRAPH PLASTICS MOTH BALLSH | [AVITAMINS SACCHARINE
WoW NOON 7
= SOIL a
MOTOR FUEL EXPLOSIVE INSECTICIDES DYES PRINTING IN MEDICINES® DISINFECTANT:
orange: fuel, explosives etc. red: for indirect use (in industry etc.) green: used in agriculture ' blue: for direct use (in home etc.) ‘ somnelalME RY py Meena LS
oe
_Gas Consumers in the Regions of Great Britain, 1946
RAMI
VY
ROT
PAPEL
SCOTLAND
oer ge
26s Sage oe OMe
antes@ NORTH EAST
MIDLAND
WEST SOUTH EAST.
Each house represents 50,000 families
blue: gas consumers
The Regions are those proposed in the Heyworth Committee of Enquiry into the Gas Industry.
sonrelgh
INSTITUT!Annual Gas Sales in Great Britain
1885 — 1890 ey
Ee
1891-1900 I a l =
1901 — 1910
1911 — 1920
1921— 1930
a
Ein
1941-1945
z
Each complete unit with flame represents 50,000,000,000 cubic feet of gas. onlLondon Area
Smoke Pollution Gas and Coke Output
1927
1937
elif
Each cloud layer represents Each flame represents ig}
100 tons of deposits per square mile. 20,000,000,000,000 British Thermal Units instr 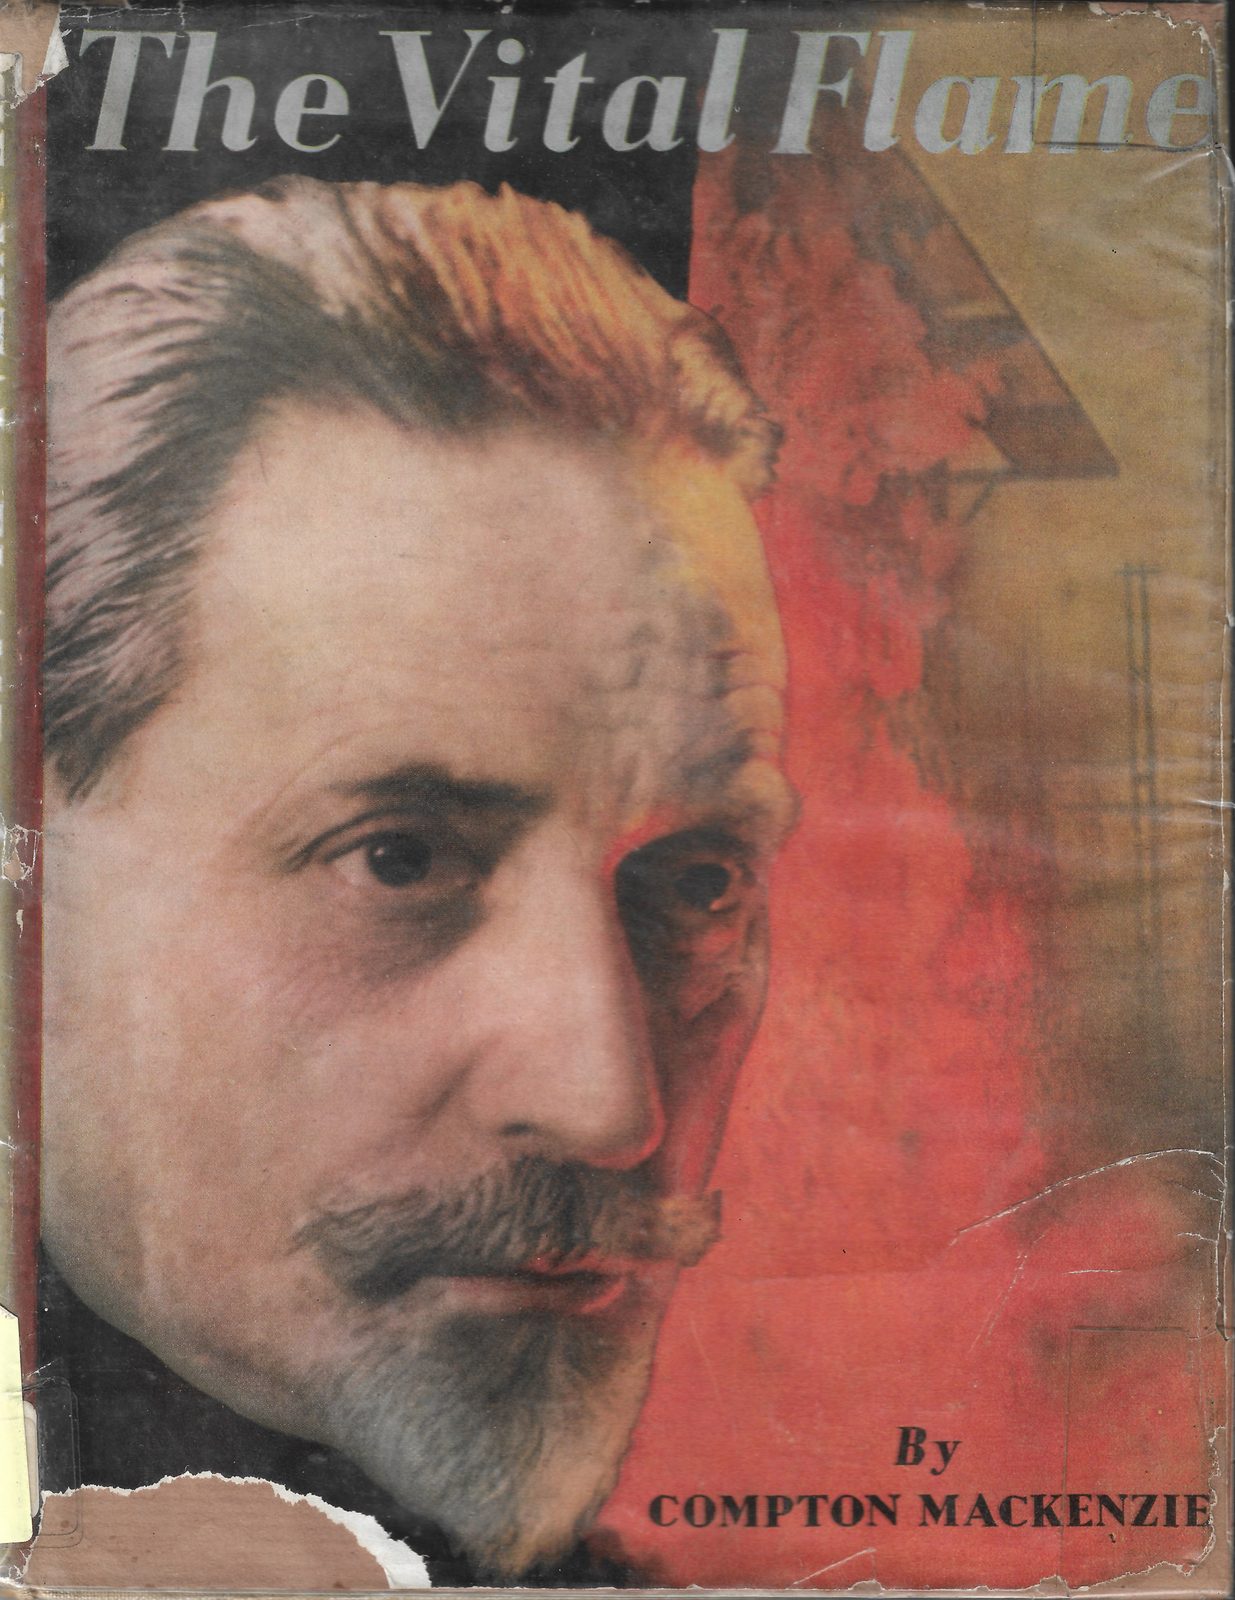
 Isotype Archive