Page text
oeOe RTY


    STEPHEN
:   TAYLOR:
Battle | for , Health | List of Pictorial Charts in ealeae
A primer of Social Medicine i.
; ca
Death-rates in London through the centuries
me
21
i The Dangerous Years 24-25
Stephen Taylor m.p. m.R.c.P.
ili The Battle against Infection 28-29
IV Social distribution of deaths from heart disease
With 13 pictorial charts in colour designed ai ee ein?
by the Isotype Institute | V Diphtheria Treatment : N-73
and 91 photographs
VI How to fight Diphtheria 16-77
Vil How people learned about Diphtheria Immuni-
sation 80-31
Vill How Syphilis spread to the Old World 88-89
IX The story of Syphilis inside the body 92-93
X The public questioned, ‘‘Do you want to know
about V.D.?” ! 96
XI The public questioned, ‘How is V.D. spread?”’ 97
XIl Deaths in Europe under one year in 1938 100-101
XII1 Unplanned and Planned Medical Services 104-105
Nicholson & Watson LondonDeaths per 100 Population iin London
CHART |
apnval Average
665 ahadlocd
® Plague.
abour’ 1710 nde
about 1870 ue hhhrhicnihichohichihirmhahioh chai
about 1910 iy Linon criti
ae Komanagnge Te rgergplioae sigitretel Remo
_ 1917. RO ay rth iheohahtohcheeotyod
WAR
1938 Stitt chiionchacheniohchiphemicheniom chai
ae
sone _ Each cross represents one death 2tCHART
I!
The Dangerous Years
Upper line of crosses represents Deaths per 400 males
Lower line of crosses represents | Deaths per 400 females g)
Causes i R Diarrhoea Bronchitis
connected . = and j and
y with birth. . Enteritis Pneumonia +
other
+
t +4
4
+
4
4
fs
15 - 35
te
+
+ t+ +
35- 45
t
+
et
' 45-50
a
50-55
+
ttt
+t tt.
tttttttt
ttttt
THtttttttt tt
ttttttttT
Sttttttttt |+ttttttt
b+ + ttttt ttt
++ +
ttttttttt FETT rttte
obop
aha
wbeb
ob
++ + obo “bob ttt ttttt ttt
tee tttttttttt tttttttttt +
CPt
t ht tttttttttt tt |
Heart and blood vessels : Reaucen Bronchitis : other
; . : akin | and ;
Ge ‘988 | Pneumonia i
24 25CHART III
The Battle Against Infection
The healthy body defends itself un % : Medical science strengthens the. defence
Small attack Resistance
partly held up by resistance Building up resistance
of wall, partly defeated by by good food, fresh air,
SoSOS
defence bodies which develop. > = = oa
and healthy habits.
. Large attack Prevention of attacks
against unprepared body wins,
elotetetetstotete?
Fencing off attacks
ot ete ete
er ete.
Sestessewposesee,
‘because defence bodies develop terete
by avoiding contacts.
too slowly.
Killing the attackers
sistety”
outside the body.
(disinfectants,
purifying water etc.)
Small attack preceeds large attack - Artificial small attack (vaccination, inoculation, immunisation)
before possible large attack.|
oS
SoS
oS $2
os re
Oey,
SRK On
‘x
SKK) wert,
GREK
OOOO
YY
ay*
by ay) aX)
OXMMME KK)
QO
RRKY
fer KN
Cae CER)
Biers, st Malate
rite ty UN
YN PR BE
i) Oe’weet ih,
COOKS a =
Seea),4,
A small attack makes the defence A large attack after a small one
bodies develop. finds a defence army ready;
to this more defence bodies are added
as a result of the new attack.
The body usually wins.
‘'
XXX ‘ >>
OOOO Mima
S>¢>
state:SS352
MOON
$2525
esos=*.S25
Ses
Soe
is
Fore
>"5
res
S
ISOTYPE
INSTITUTE by injection of extra defence bodies or by chemical killers.
28
29CHART IV
Distribution of Deaths from Heart Disease and ___ Tuberculosis
Between ages of 20 and 35 | Between ages of 55 and 65 Between ages of 20 and 65
(almost all rheumatic) (very little rheumatic) (Pulmonary Tuberculosis)
_ Semi-skilled and agricultural labourers
fii
Unskilled labourers
. Each cross represents 20 deaths ~
il : ; from tuberculosis per 100,000 persons
ISOTYPE
INSTITUTE Each cross represents 20 deaths from heart disease | per 1 million persons living in that social group living in that social group
68
69CHART ¥
Diphtheria Treatment
among 20 cases
=n tttCHART VI
How to Fight Diphtheria _
Two small pp picks Immunisation
protect a child by
immunisation _ In Toronto (Canada) Cases of Diphtheria Deaths from Diphtheria :
boyGORAOEfaite,
POR
Y “
sian
ees
nee
aea
wes f
aalesanes
appooemenneneoaaecne)
ReARRERARRRCL
oloema see
seteAP Soave eqan:
Seaieseas
sane aaa
ata 1933 - 36
Each bed represents 50 cases per year. Each cross represents 50 deaths per year
ORR tnvEngnane: ape Wale:
: si -rcmaeeemeenooeepeppeeepet.t
eeeceeetenpers 1921- 30
eseqanee5 1931-41
Dic. mamaooenenenenpeepeeameaml|
YO, = tl NR CRO SO aS Ol aCe Sales
Toe aaSATIS Scsaesaaan
Semana se Ae reeleae2 1942
i Se
inantsetae
| sa
“red:
Ramanan nnn
av rage proportion of Each bed represents 50 cases per year Each cross represents 50 deaths per year
ihe immunised per million population per million population
77
76i
)
: | :
CHART VII
How People Learned about Dipn heme cnection
HAVE YOUR CHILD IMMUNISED!
wipe Doctors, Nurses (@) Press,
People learned through: =| Schools, Welfare Services, - Radio,
Nursery Schools
: Films,
Posters,
Circulars
77]
SLL
friends,
relatives,
neighbours
Each symbol represents 1 among 20 persons questioned
80.
nll
81CHART VIII
How Syphilis Spread to the Old Wout |
x
au
M i)"
8
ihwi
Russia 1499
Japan
a, 1569
ihmT
A»
San é
Domingo ES
EColumbus' crew.
i.
Canton (China)
Africa 1497 => India 1498
black : 1493-1495 blue: 1496-1499 - ‘red: 1500 and after
88 89CHART IX
The Story of Syphilis inside the Body Defence Against Syphilis
| vee if untreated
Infection
Ist stage
1 year
2 years
=
‘2
5-25 years
after infection ae donee 4G “ |
3rd stage
treated
The height and shade of the wall indicates the extent of obvious symptoms
92 93CHART X ‘CHART XI
The Public Questioned The Public Questioned
Do you want to know about V.D.? - How is V.D. spread ? ANSWERS
Correct through sexual intercourse
ANSWERS Yes| 2 Half correct
AAAAAA
through sexual intercourse or lavatory
Incorrect through lavatory
No Answer ‘Does not know how it is spread
7.22 1
No Answer Does not know what V.D. is
? 9?
e e
] : Each symbol represents
Each symbol represents 1 among 40 persons questioned cal Boho 1 among 10 persons questioned
06. 97CHART. XII
- Deaths under 1 year per 100 Live Births. bs aL
AY AND’ EDEN
wy
%
ve FINLAND
—
Dye
ee FRANCE AUSTRIA
< < ?
an
Vy ( S ap
dl
up to 3 deaths -. ae
over 3 up to 6 over 9 up to 20
over6upto9 - eg over 20 deaths . ‘ia : a ea i
Hanon
100 : | : : IOIAn UnplannedMedical Service -
- CHART XIII
A Planned Medical Service
Municipal Hospitals Key General ‘Hospitals
or aaaAA| mma)
aaaal
A
Voluntary :
a TTT
[Y Hospitals Nursing
Homes mim mo ho
Municipal Clinics linics of
Local Medical Centré
Vo} Hosp.
° hay
exe
=|
|i
Oa
a|
ne
Li
Bel Ue | 20 9
ie he | i
' Practitioners
General Praciiaren
in Health Centres
AHA Ly
40 million people
black arrows: movement of patients blue: the well-to-do
_
(getting over £10 a week) Each. bed symbol stands for 20,000 hospital beds _
. red arrows: movement of doctors
ent
Each doctor symbol stands for 2,000 doctors
104
105 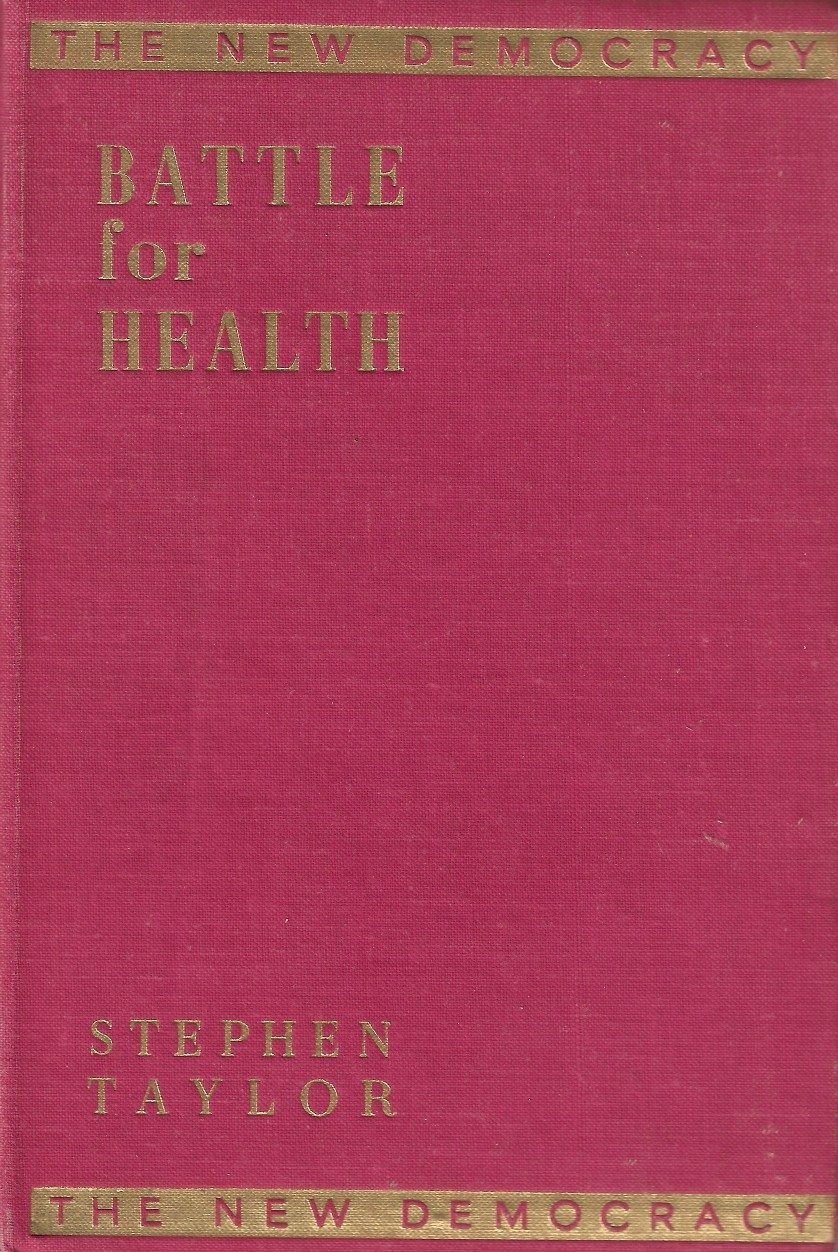
 Isotype Archive