Page text
AMERICA            AND    BRITAIN                                    LIST OF PICTORIAL CHARTS             IN COLOUR


                                                                     BIRTHS AND DEATHS 1938                               Chart   1


                                                                     MARRIAGE AND DIVORCE                                 Chart
                                                                                                                              2


                                                                     NEW YORK 1850-1930                                   Chart   3


                                                                     LONDON 1850-1930                                     Chare   4


OUR            PRIVATE                   LIVES                       URBANIZATION OF THE POPULATION 1850-1930             Chart   5.


BY LELLA SECOR FLORENCE                                              SEX DISTRIBUTION IN 1930                             Chart   6


                                                                     THE YOUNG POPULATION AGED 13-20                      Chart   7
FOREWORD      BY   NORA   WALN


                                                                     UNIVERSITY STUDENTS AND POPULATION AGED 20-23        Chart   8
WITH   16   ISOTYPE   CHARTS   IN

COLOUR AND 32 PHOTOGRAPHS                                            PERSONAL SERVICES                                    Chart   9


                                                                     SIGHT-SEEING CENTRES, PLAY GROUNDS   UNITED STATES   ‘Chart 10


                                                                     SIGHT-SEEING CENTRES, PLAY GROUNDS, GREAT BRITAIN    Chart 11


                                                                     MOTOR CARS, TELEPHONES, RADIO SETS, 1937             Chart 12


                                                        ¥.           POPULAR FESTIVALS                                    ‘Chart 13


                                                                     TEA, COFFEE, AND MILK CONSUMPTION                    Chart 14

                                GEORGE G. HARRAP & COMPANY LTD.
                                                            SYDNEY
                                                                     MEAT CONSUMPTION                                     Chart 15
                                LONDON   TORONTO   BOMBAY


                                                                     THE CINEMAS AND THEIR WEEKLY ATTENDANCE              Chart 16
Births and Deaths in 1938
per 500 population
United States ead ead ead e
aperd oad aah wad wo
es
GBaaad
Great Britain ead cad oa
d oad cad cad ord o
ad
bse Bee is Gib ath bed
ee el tt er
comer af ab cab orb cas ors ors crs crs ers
Bdaawas
Britain and America come between Germany and France in birth-rates and have
comparatively low death-rates. For a simple comparison between private lives these
rates are based on general population and take no account of age grouping. But more
babies than coffins does not mean that the increase in population is going to continue.
That depends on the proportion of women of reproductive age and their fertility.ae and Divorce
fiiiit igi
thiin aveitil Hii
United States
Great Britain:
France
GermanyNew York ere
Beginning of the 19th Century
Beginning of the 19th Century
\ vox
B a w
NES ey
,
Z A ) SNeYe
jin Ne eZ FAW
aWas
Beginning of the 20th Century
} ; ALLA
P. Bi /\ A} i
Beginning of the 20th Century
Py \] A
y
ee
Hee Xi cL
Sk
)an
=
In America and Britain cities have grown rapidly
in the last hundred years, Compared with New York (chart 21), London’s lay-out mostly grew up as
but as comparison with chart 22 shows their lay-out is very different.
need arose.
1 22Urbanization of the Population
United States | Great Britain
1850 1850
fre OW =
1930 1930
ad
Each row of symbols represents 20 million population ~
3 red: in cities of 100,000 inhabitants and more isl
23 |Sex Distribution in 1930
eveeviiit
am evi
United States
| —
~ Each complete group symbol represents 5 million population
blue: males red: females
Each complete additional individual symbol represents
50,000 persons
blue: more males than females
ISOTYPE igs
INSTITUTE
red: more females than males
The farther west, the more men compared to women.
24The Young Population aged 13-20
United States Great Britain
How many out of ten in each age group
How many out of ten in each age group
stay at school are gainfully occupied
stay at school are gainfully occupied
[> * Ca
A
A
AKA
AMA
20
blue: at school red: gainfully occupied grey: others about 1930 sorrel
Starting at age thirteen and comparing the next age groups to
14 15,16to17, and 18 to 20, at school or college steps down. But at the age 14 to 15 the stepping is much greater in Britain,
and less than 10 per cent. continue education after seventeen.
the proportion going to work for money in both countries steps up, while the proportion
25University Students and
Population aged 20-23
Each blue symbol represents 10,000 university students in 1932
Each grey group represents 1 million population aged 20-23 years
26Personal Services
per 200 Population
UNITED STATES
GREAT BRITAIN
PELL ISOTYPE rn
INSTITUTE
For every 200 of the population eleven or twelve persons were in 1930 engaged on
personal services in Britain, but only seven or eight in America. The difference is
least in catering, hairdressing, laundries, and other commercial jobs; greatest in
private employment in the home. The proportion of cooks, housemaids, and other
domestics to total population is in Britain almost twice the American proportion—as
seven to four.
2/Sight-seeing Centres and Play Grounds, United States
Canada
IN
Niogere
cape : °3
8
Ford Motor Plant
de nc ® H el l e
‘o-Evrope
= 4 \n pen’ = atic any
? an
\ NG
=
red: historical L \
New Orleans
green: landscape
blue: seaside, water sport fiorida Coot!
check: sport and shows
grey: industrial
ISOTYPE tl
INSTITUTE
Asample of the more popular resorts. Britons (Chart 29) are offered more choice by history and! seascape, Americans by landscape—but some of them have far to go.
28Sight-seeing Centres, Play Grounds
Great Britain
p
red: historical
Braemar green: landscape
A blue: seaside, water sport
p
Ben Nevis
check: sport and shows
St Andrews
grey: industrial
Trossachs
iN <AAS
Edinburgh
Melrose Abbey
Gretna Green
lake =
Scarborou —s
fisle of Man f =
Eas Blackpool York Minster
Tourists to Ireland
Dovedale
Snowdon
Broads
Bournville
Eisteddfod
ARNO SKM
Stratford-on-Avon
Cambridge
Piccadilly ———
Windsor ! Epsom
Canterbury
A
Stonehenge Winchester
: Brighton
Dartmoo: =
=
= Ea
*
— =
Ss
Isle_of Wight
ourists to the Continent
ISOTYPE
INSTITUTEMotor Cars, Telephones, Radio Sets 1937
per 50 population
United States i is Rs 5, Ss Ry Sy ER, Sh,
RPPPLTrT@re
cca
Bm
See
France i GR, SR
=
Bea
earcn ond
‘BGBaaE ie
30Popular Festivals
Calendar United States Calendar England
January m 4 NEW YEAR January
LINCOLN’S BIRTHDAY
February WASHINGTON'S BIRTHDAY February
March March
A BOAT RACE (OXFORD-CAMBRIDGE)
April
Aen GOOD FRIDAY EASTER MONDAY
» = 4 MOTHERS’ DAY DERBY DAY
May, MEMORIAL DAY May WHIT MONDAY
June June
July > INDEPENDENCE DAY July
August August |S BANK HOLIDAY
September ~S LABOUR DAY September
October m 4 HALLOW-E'EN October
Nee es ARMISTICE DAY Rae oy GUY FAWKES
eval THANKSGIVING DAY mia ARMISTICE DAY
December S CHRISTMAS DAY cee CHRISTMAS DAY
pata BOXING. DAY
Festivals falling on a Sunday, as Easter Sunday, Whit Sunday, are not included
san
Blue: church festivals and days after church festivals
Red: commemoration of historical events
Both countries celebrate on about as many days throughout the year, but
Grey: national sporting event American festivals depend more on historical occurrences and English more on
Green: custom or legally appointed movable Church feasts and sporting events which may, in some years, be in a neigh-
bouring month to that charted. Scots, like Americans, celebrate the New Year and
do not follow English Bank Holidays or sporting fixtures. Guy Fawkes Day and
13 Hallow-e'en appeal particularly to the young.q ee :
te
Tea Consumption ey Coffee Consumption
United State TREREREREKERKEREERE SE
or BR & eR eR OR RK BeE
esi rk&REERE EEE
Each symbol represents one pound Each row of symbols represents the averog annual consumption per head 1930 - 1934 cert
Milk Consumption
United States ] \] J ]
Great Britain J J
Switzerland \] \] | J J UJ
Italy J
Each blue symbol represents 10 gallons
Each row of symbols represents the average annual consumption per head 1930-1934
Here duly charted is a major difference in the private lives of Britons and Americans. Cup represent pounds of tea or of coffee, and since a pound of tea goes farther Britons probably
drink more tea than Americans do coffee. As for gallons of milk, Switzerland sets a target fir all.
oeMeat Consumed per Head
B Pork Beef v e Mutton
United States
Id4 4 d 4
France
Jdddd4
Each symbol représents 10 Ibs.
Each row of symbols represents the average annual consumption per head, 1933-1937
cons kad
INSTITUTE
i
An average Briton eats more meat than an American, a German, or a Frenchman,
: i :
particularly beef and mutton; i
but the American co mes in a close second. The
Anglo-American consumes on a scale well above the Continental European.and Their Weekly Attendance
s (Ce ©
:
ae22
o§
aa 5,2
re ne a cr a a a ee oF kbs
cami, GE, ere, mug, ong, condi, maa, ei cena -oneg cama 22 § 8 eo
cong, en, Aa, aa cami ari: eg eee wang” eons ro = 53 : gS
a a es a =: 3 ;
coe, RE, RIE, NL, AE, IN, cee, ea, a eR, RE, el, ene et ag oe od ef ea,
The Cinemas
oss, aii, US oma, mE cana, meal, came, ee, ere oS ony, an, amt cam <a 44 "a 5 3
cami, one, ona, wai, oct, a, a wae cena, eo, ore og eae
== >9
Pa: ce
5 = BF Oe
= 5 gsgzecs
— ob} ome 9 ic
Cc } Ss = Oo
= © 2 Bex 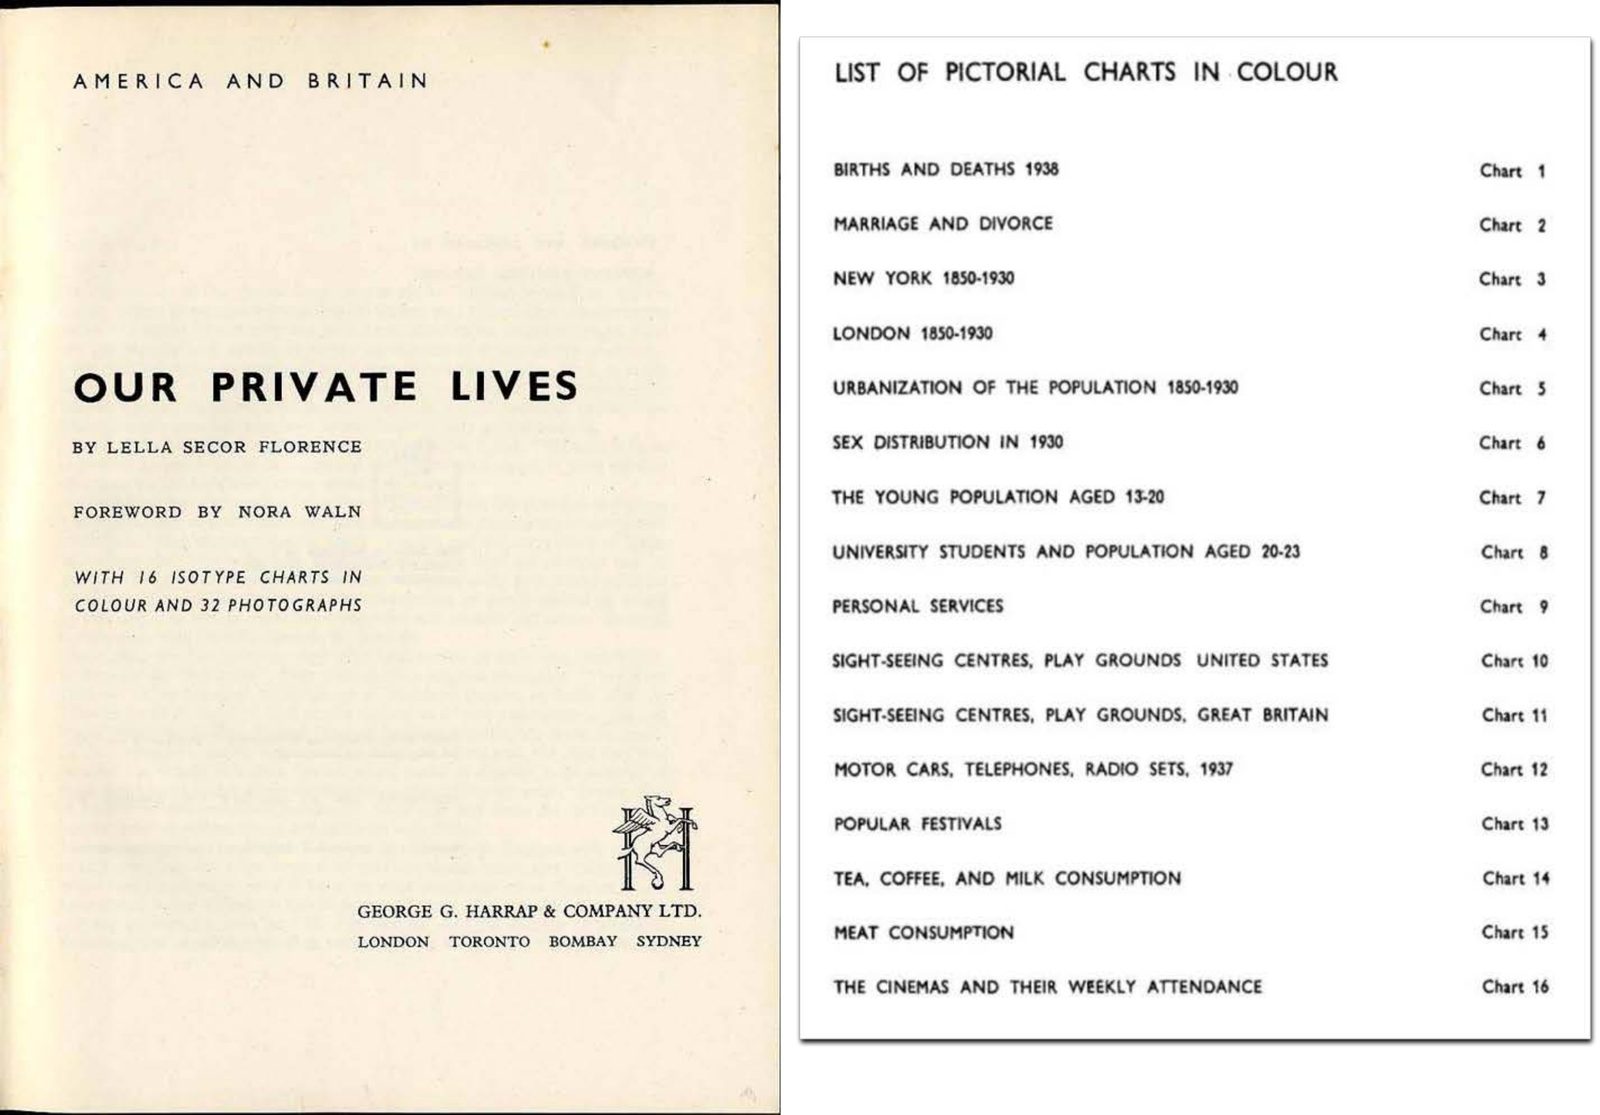
 Isotype Archive