PINCH, ⌘ / CTRL + SCROLL, OR + − TO ZOOM · DRAG TO PAN
Bildstatistik nach Wiener Methode in der Schule
1933 :: BOOK
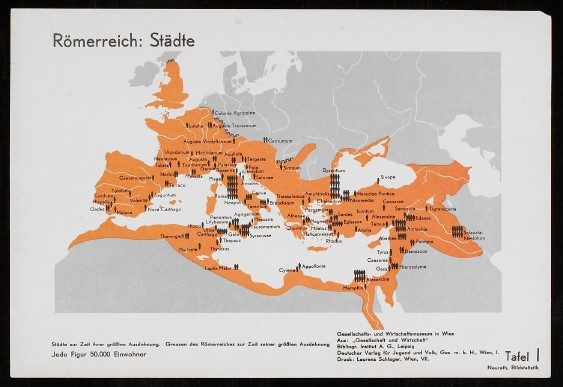
Set of 24 numbered plates (Tafeln) of Vienna-method pictorial statistics for school use, each credited to the Gesellschafts- und Wirtschaftsmuseum in Wien and running-headed "Neurath, Bildstatistik". Charts cover cities of the Roman Empire, world population groups and economic forms, marriages, births and deaths and infant mortality in Vienna, English iron production, coffee, cocoa and tea trade, US pig-iron and automobile industry, employment of men and women, telegraph lines, Austria's age structure and Vienna municipal spending. Later plates explain method (comparing quantities by squares, circles and unit rectangles, Mercator distortion, three-dimensional statistics, a symbol sheet) and show charts made by Viennese schoolchildren. Several plates are marked as taken from the atlas "Gesellschaft und Wirtschaft" (Bibliographisches Institut, Leipzig); printed by Laurenz Schlager, Wien.